Ebben a leckében a sávdiagramok 1-1 fajtája és 4 feladat segítségével gyakorolhatod a grafikonelemzést. A lecke végén a megoldást is megtalálod egy letölthető fájlban.
1.Tanulmányozd a sávdiagramot és válaszolj egész mondatban a kérdésekre.

What does the bulk chart inform us about?
What is the source?
Which year do the data refer to?
What does the vertical axis represent?
What does the horizontal axis show?
Which retailer took the first place?
Which online retailer had the second highest sales?
Which retailer took the third place?
Where can we see the lowest value?
How much was this value?
What can be seen if we compare the sales of the retailers?
2. Nézd meg az alábbi ábrát és válaszolj egész mondatban a kérdésekre.

What is the topic of the bulk chart?
What is the source of the graph?
What do the data refer to?
What do the data represent?
What does the vertical axis show?
What does the horizontal axis show?
What ranking can we see in 2014?
Payment with debit card has the second highest value with 19.6 %.
Which payment method had the lowest value?
What changes can we see from 2014 to 2015?
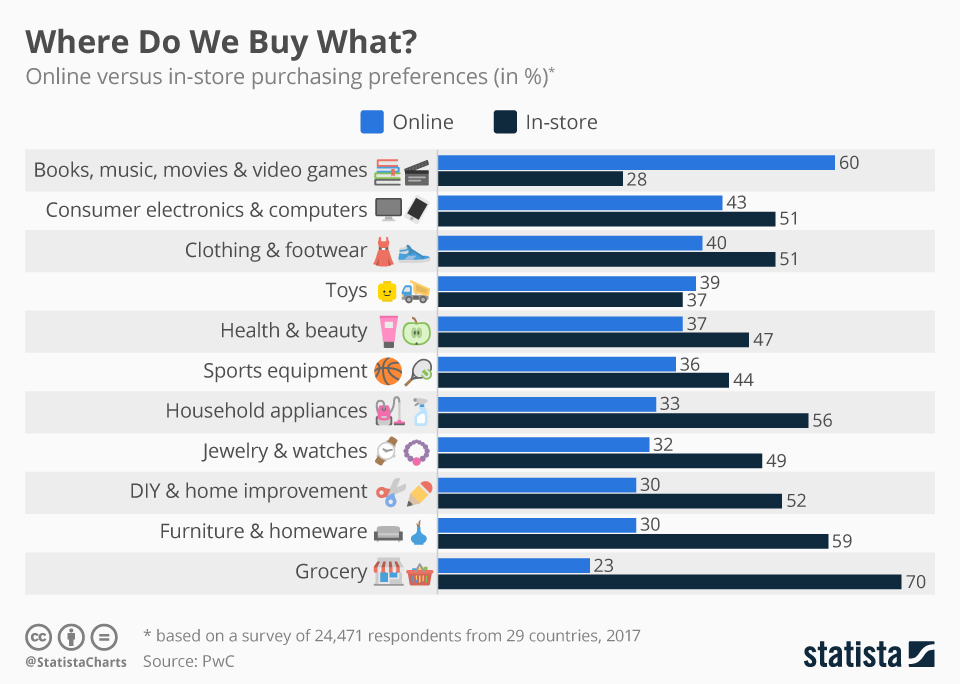
3.Nézd meg a sávdiagramot és egészítsd ki az elemzésben a mondatokat.

This bulk chart _________________ about the purchasing preferences of customers.
_________________ a source. It is Statista.
The _________________ to the year 2017.
The _________________ shows the different groups of products and the horizontal axis shows the purchasing preferences in _________________.
The light blue and dark blue bulks represent _________________ purchases.
_________________ online purchases, we can see that books, movies and videos games had _________________ with 60 % in 2017. _________________ had the second highest value with 43 %. Clothing and footwear took _________________. Grocery products had the lowest _____________ with ______________.
Comparing the two product rankings we _________________ difference.
In terms of in-store purchases, _________________ highest share with 70 %. Furniture and homeware _________________ the second place. _________________ took the third place with 56 %. Books and videos games _________________ with 28 %.
From the information shown we can see that people preferred buying products in-store _________________ books and video games.
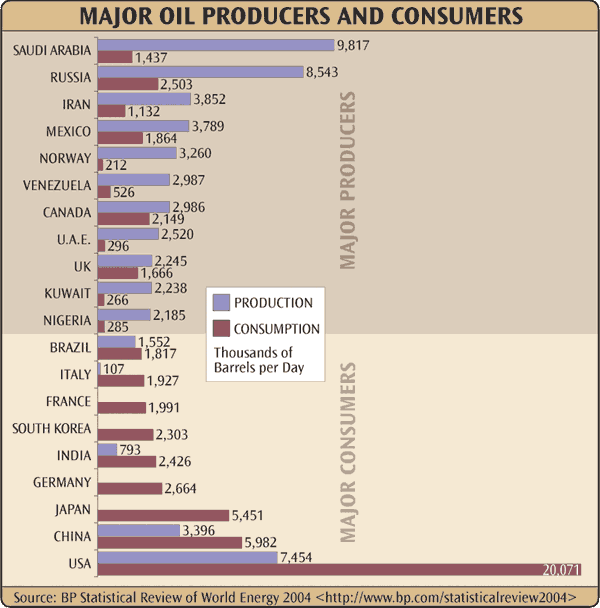
4.Nézd meg alaposan az alábbi grafikont és egészítsd ki az elemzés mondatait.

This bulk graph _________________ about the major oil producers and consumers.
The data refer to _________________. The _________________ is the BP statistical review.
The horizontal axis shows the oil _________________ in thousands of barrels _________________. The vertical axis represents the _________________.
If we look at oil production, we can see that the _________________ was Saudi Arabia _________________ barrels per day. However, its _________________ was a lot lower.
Russia _________________ place with 8.5 million barrels. _________________ took the third place with a production of 7.4 _________________.
As for consumption _________________ far the largest consumption with 20 million barrels. China _________________ value with 5.9 million barrels. Japan took _________________ 5.4 million barrels.
From the _________________ shown we can see that countries such as _________________ were only consumers of oil.
In other countries, like in _________________, oil production exceeded consumption considerably.
We can’t see any significant difference between the oil production and consumption in _________________.